Controls operation
The Controls operation view compares how the controllers of the turbines of a farm operate: pitch, rotor speed, yaw and power. Each turbine is compared with the other turbines of the same farm, over the same period, and month by month.
Typical use: find a turbine whose pitch, rotor speed or yaw behaviour differs from the others, and check that it has not changed over time.
Data selection
Only 10-minute records in which the SCADA status of a turbine is full performance are used. Stops, curtailment and derating would otherwise mix operating modes that the controller does not choose. The comparison and the drift can be restricted further to a range of SCADA power, for example the partial-load region below rated power.
Operating curves
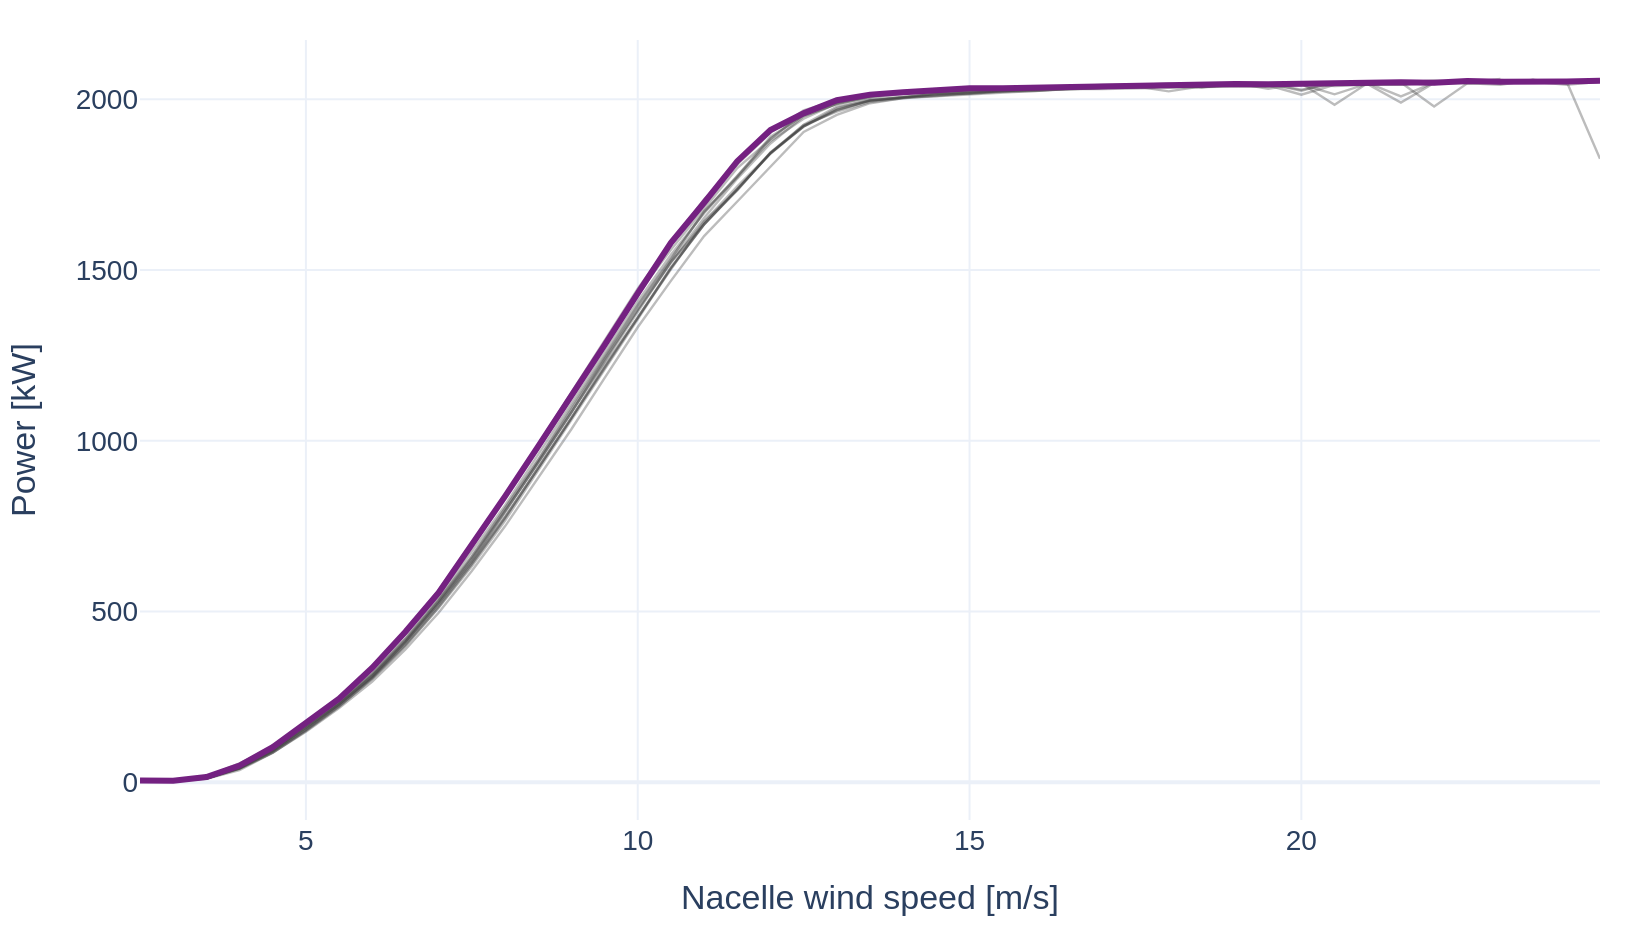
For each turbine, a SCADA signal is averaged in bins of nacelle wind speed (0.5 m/s) or of power (one fiftieth of rated power). Six curves are drawn: power and tip speed ratio against nacelle wind speed; rotor speed, blade pitch and yaw misalignment against power; and the quantiles of the Tipspeed wind speed against those of the nacelle wind speed, from the 1st to the 99th percentile of each turbine. Each curve but the last can be drawn against the other axis: power against expected power, the tip speed ratio against power, and rotor speed, blade pitch and yaw misalignment against nacelle wind speed. On a wind speed axis, a power range is shown at the wind speeds where the median power curve of the turbines reaches its bounds.
Turbine comparison
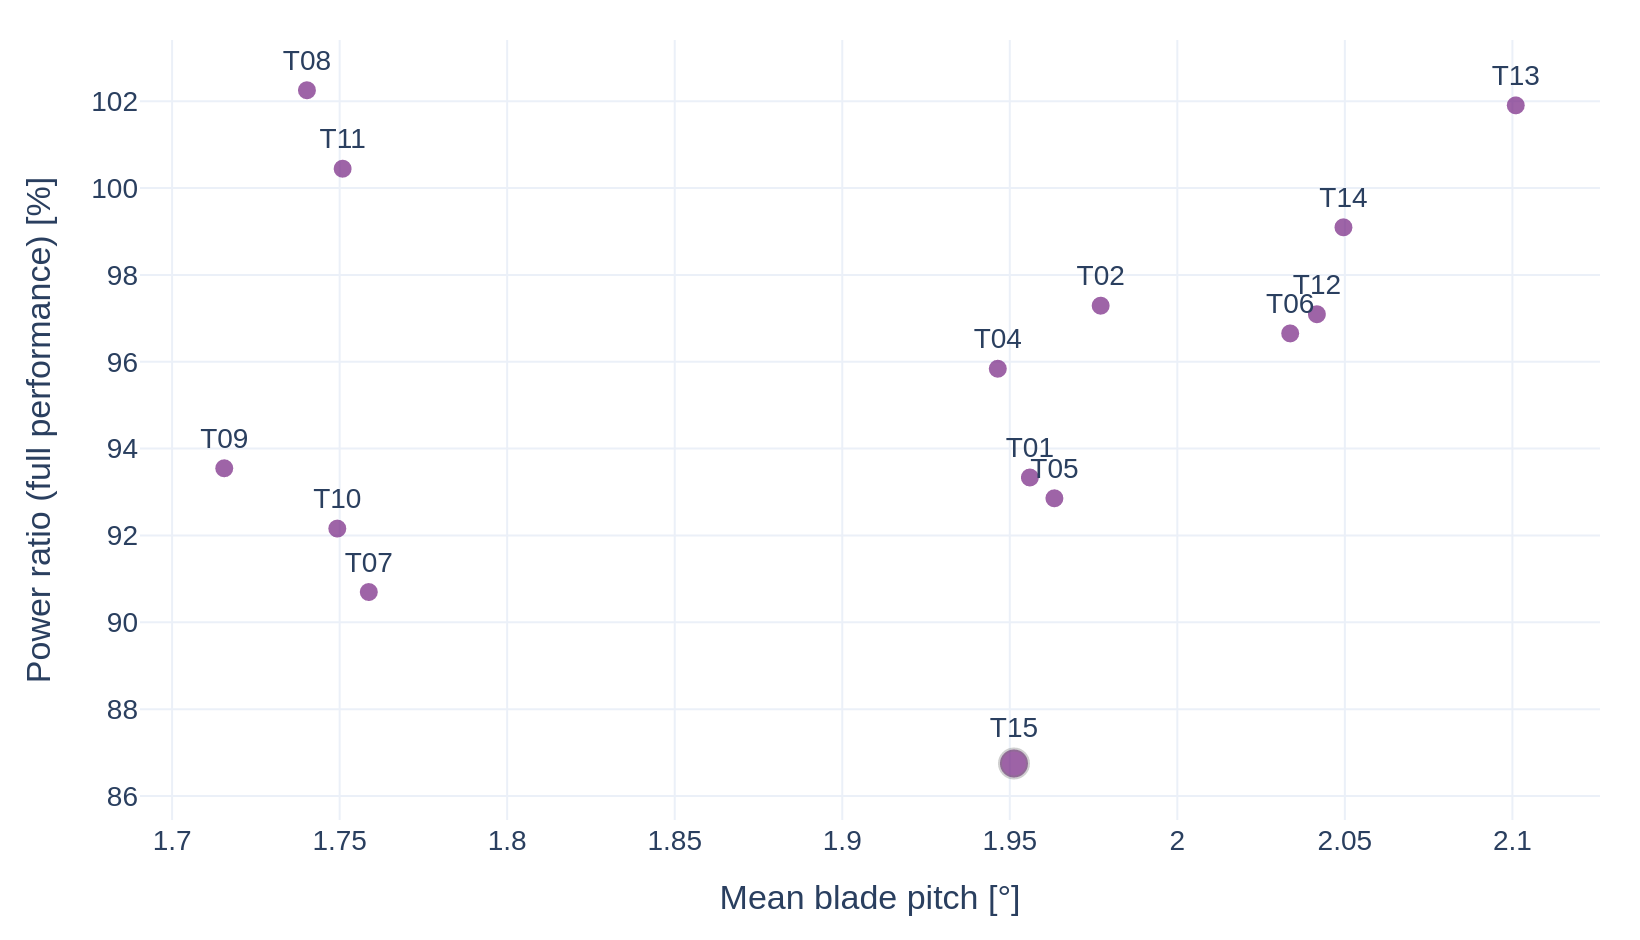
Each turbine is reduced to one point: the mean of two metrics over the selected records, one on each axis. Both axes are chosen among the controller metrics (power ratio, nacelle wind speed, ratio of nacelle to Tipspeed wind speed, Tipspeed wind speed, blade pitch, rotor speed, power, Tipspeed expected power, yaw misalignment, tip speed ratio, torque-speed gain, nacelle power coefficient). The selected turbines are drawn in purple and the other turbines in grey. A turbine set apart from the group is a candidate for inspection.
Monthly drift
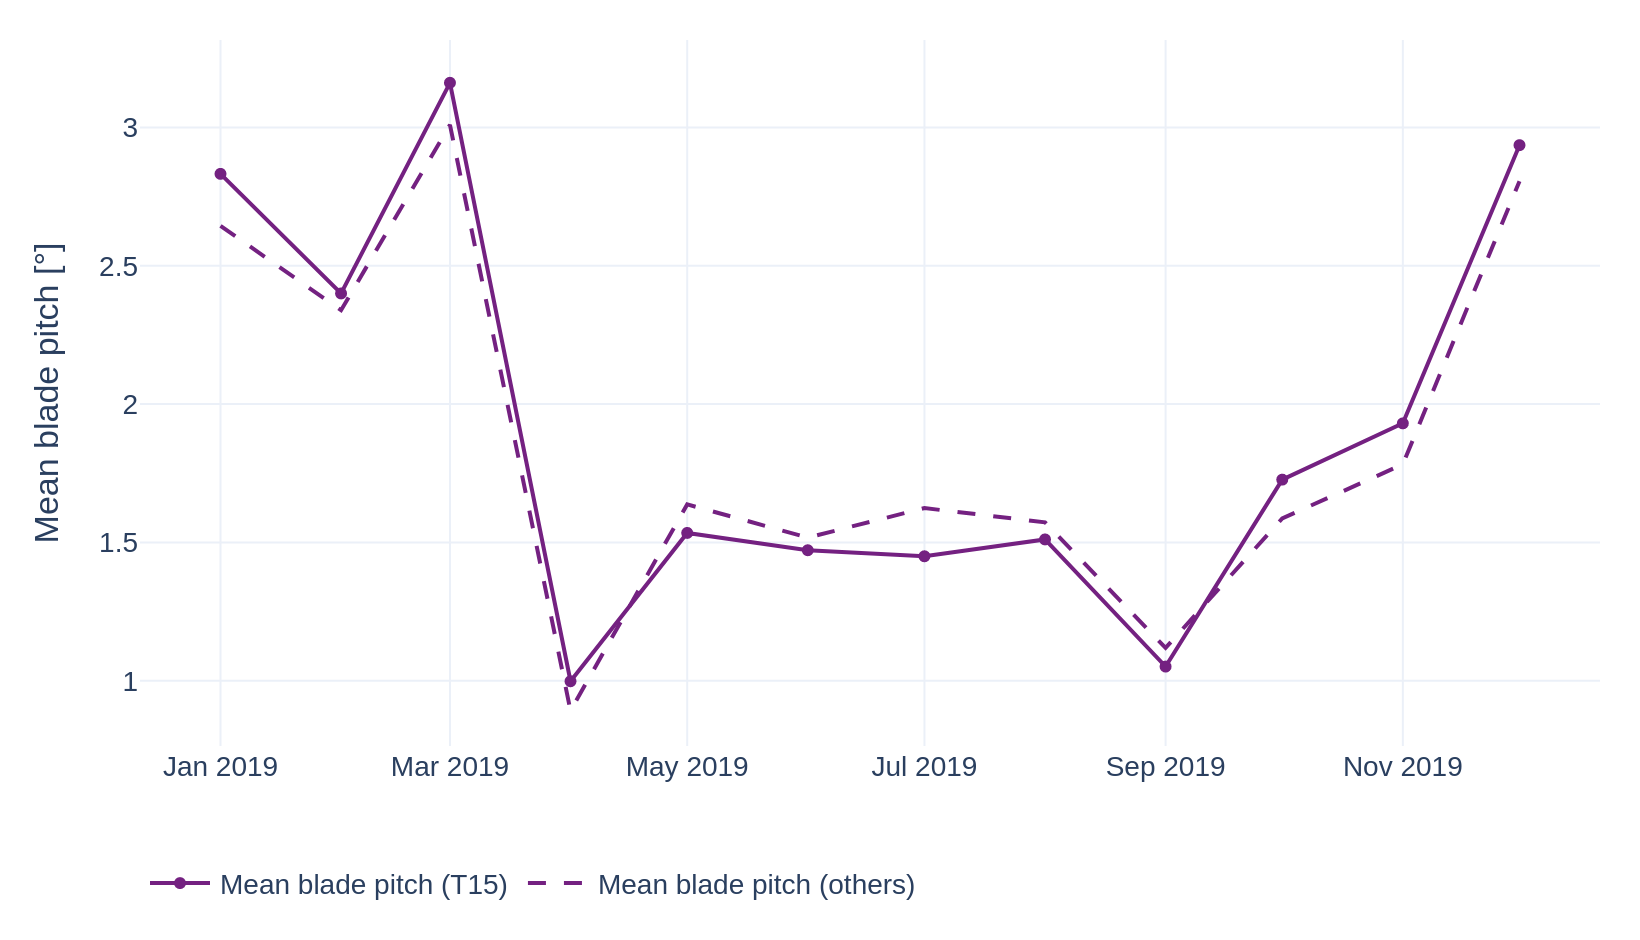
The same metrics are computed per calendar month for each turbine. The selected turbines are averaged into one line and the other turbines into a second line, each turbine with the same weight. Wind conditions move both lines together; a change in the gap between them points to a change in the selected turbines themselves. A month with less than one day of full-performance records is left as a gap.
The mean of the turbines outside the selection is drawn in grey, inside a shaded 90% confidence band:
where \(\bar{x}\) is the mean of the monthly values of the turbines outside the selection, \(\sigma\) their standard deviation and \(k\) their number. A month with fewer than two other turbines has no band.
Nacelle power coefficient
The nacelle power coefficient is the share of the power in the wind measured by the nacelle anemometer that a turbine converts into electricity. It is the mean power divided by the mean power in the wind over the same full-performance records:
where \(\rho\) is the Tipspeed air density, \(A\) the rotor swept area and \(U\) the nacelle wind speed. A ratio of means keeps the low-wind bins stable, where a single record's ratio would diverge. The nacelle wind is not the free wind, so the coefficient is only compared between turbines of the same model.
Operating regions and correlations
The operating regions (cut-in at fixed rotor speed, variable speed, knee, rated power) are detected from the 10-minute records of each turbine model. Selecting a region at the top of the view sets the power range of every chart to that region. A further view shows the correlations between the controller variables of the selected region and the power ratio, across the turbines and over time; selecting a pair opens it in the turbine comparison or the monthly drift. The fitted cut-in wind speeds and pitch slopes can be shown in the turbine comparison and the monthly drift. The expected power curve of each turbine model is drawn as a dashed grey line on the power curve.