Digital twin
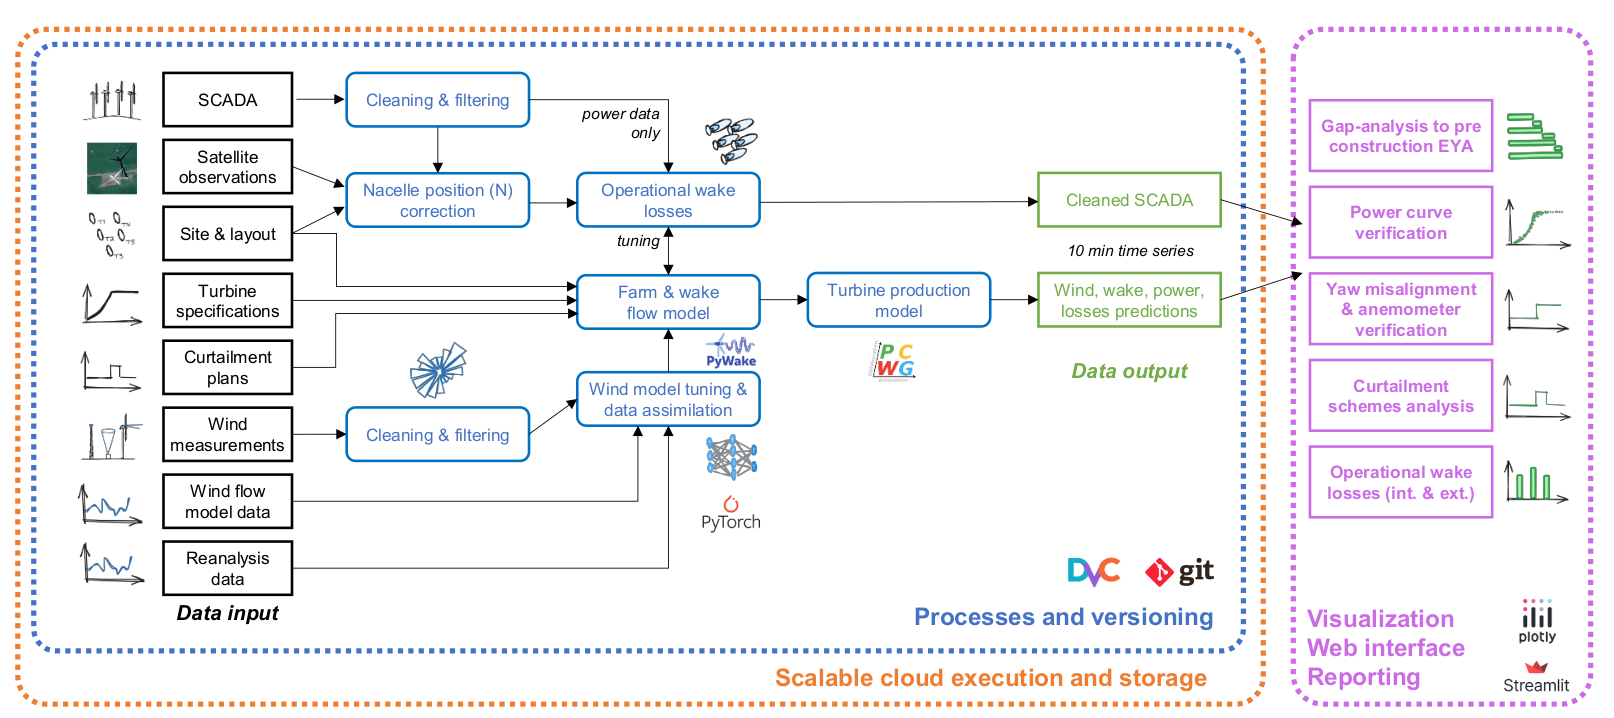
Tipspeed analyses wind farm performance by comparing the operational data of the assets with independent reference data produced by a physics-based digital twin augmented with observations. The comparison is made turbine by turbine on 10-minute time series. This resolution makes it possible to identify sources of underperformance, such as yaw misalignment, degraded power performance and availability, and to quantify the improvement potential of each.
The digital twin consists of three layers of physics-based models:
- a wind flow model;
- a wakes and blockage model;
- a turbine performance model.
Each layer is tuned and calibrated against a broad range of data sources:
- the site layout and the reference power curves configure the simulation;
- pre-construction and operational wind measurements calibrate the wind flow model;
- satellite observations resolve the orientation of the turbines;
- production ratios between turbines, taken from SCADA data, refine the wake and blockage models.
SCADA data never set the absolute level of the expected production. They are used only for relative quantities: production ratios between turbines, to tune the wake model and the wind direction offset, and time synchronisation. The absolute level comes from the wind flow model, the wind measurements, the reference power curves and the site-specific performance corrections.
The methodology is described in previous publications (Davoust, 2024a), (Davoust, 2024b) and (Davoust & Delaunay, 2025a). It was validated blind against 18 wind speed sensors at six sites, using pre-construction data only: the mean bias was −0.01 ± 0.10 m/s (see Validation).
Wind flow
The wind flow model reconstructs the wind conditions at each turbine from an atmospheric large-eddy simulation at 100 m horizontal resolution. Calibration of the model on site data is organised in five levels. See Wind flow.
Wakes and blockage
Wake and blockage losses are the production losses caused by the wind speed deficit downstream of the turbines and by the reduction of wind speed upstream of them. Tipspeed computes these losses on 10-minute time series, with the wake model best suited to each site, tuned on operational data. See Wakes and blockage.
Turbine performance
The turbine performance model converts the wind conditions at the rotor into expected power. It applies corrections for air density, turbulence intensity and wind profile to the reference power curve. See Turbine performance.
Long term
The long-term quantities of the waterfall are the analysis window recomputed with the long-term wind climate of the site, through a representative period. Year-to-year variability is removed; seasonal and diurnal cycles are preserved. This separates the effect of a low-wind period from underperformance. See Long term.