Power curve
The measured power curve of each turbine is compared with its commercial power curve. Both curves are converted into an annual energy over the same wind: the wind at the turbine during the analysed period.
Typical use: compare a turbine or a fleet with the commercial power curve without a measurement mast, and distinguish an underperforming turbine from a biased nacelle anemometer.
Measured power curve
The measured power curve follows the method of bins of IEC 61400-12-1, on the full-performance records of the period. The wind speed is normalised to the reference air density of the commercial power curve.
The nacelle anemometer sits behind the rotor and does not measure the free-stream wind speed. An anemometer that reads low makes a turbine appear better than it is, and one that reads high makes it appear worse. The measured power curve is therefore built twice: on the nacelle wind speed as measured, and on the nacelle wind speed corrected onto the expected hub-height wind speed of the Tipspeed digital twin. The correction removes a calibration bias of the anemometer.
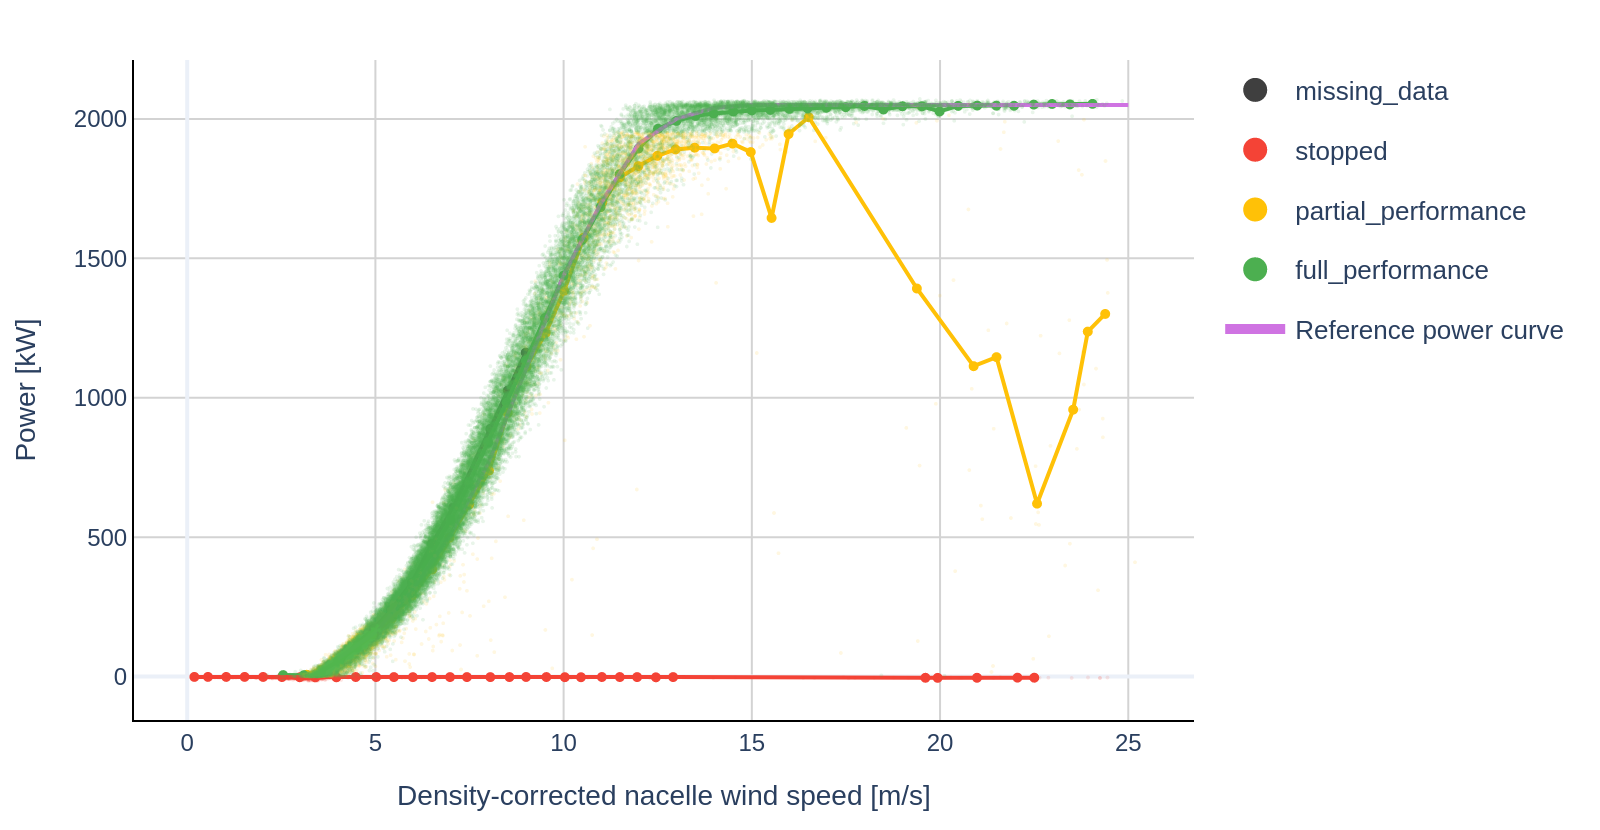
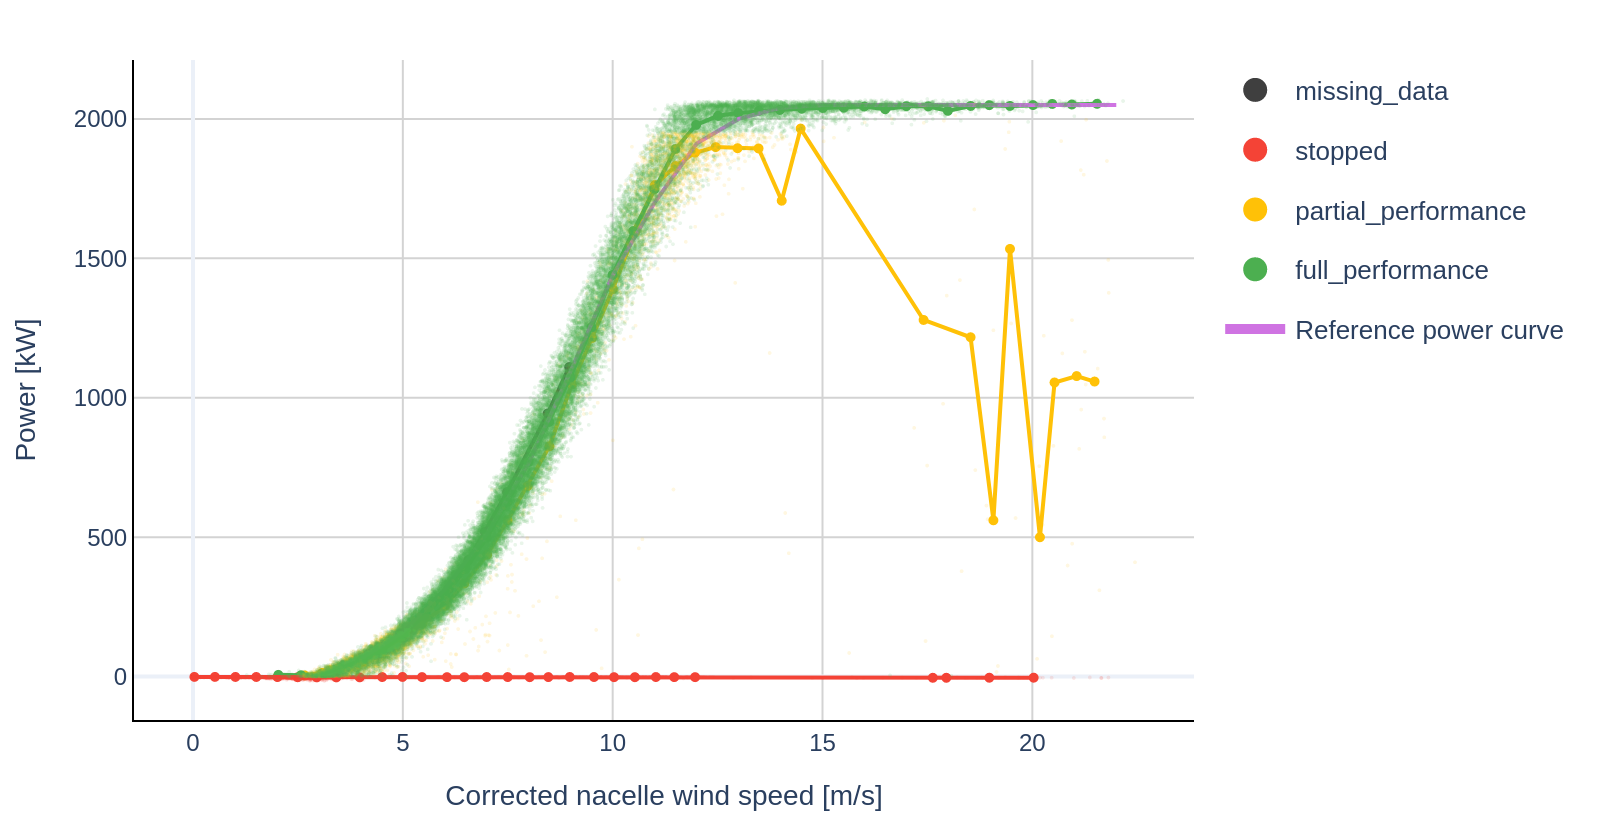
Annual energy deviation
The deviation is the difference between the annual energy of the measured power curve and that of the commercial power curve, in percent of the latter.