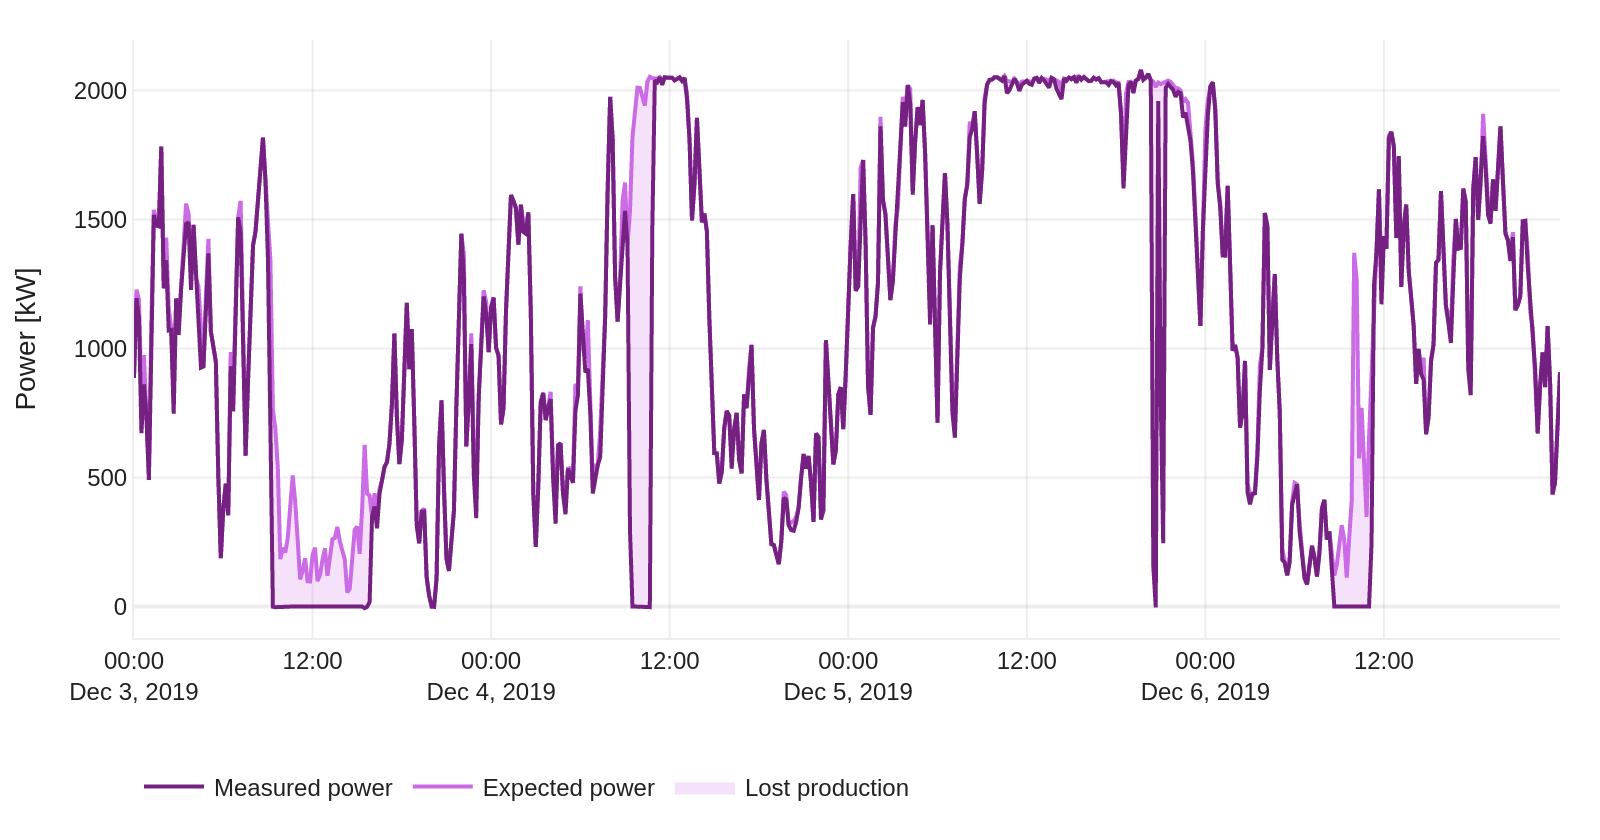
Expected power and lost production
Expected power is the power a turbine would have produced in each 10-minute period, including periods in which it was stopped, derated or had missing data. Lost production is the difference between expected power and the power actually produced.
This expected power reflects the recent behaviour of each turbine and is used for availability losses only. The underperformance of a running turbine is measured against the digital twin (see Performance ratio).
Typical use: lost production by operating status supports availability reporting and discussions on the manufacturer's availability guarantee.
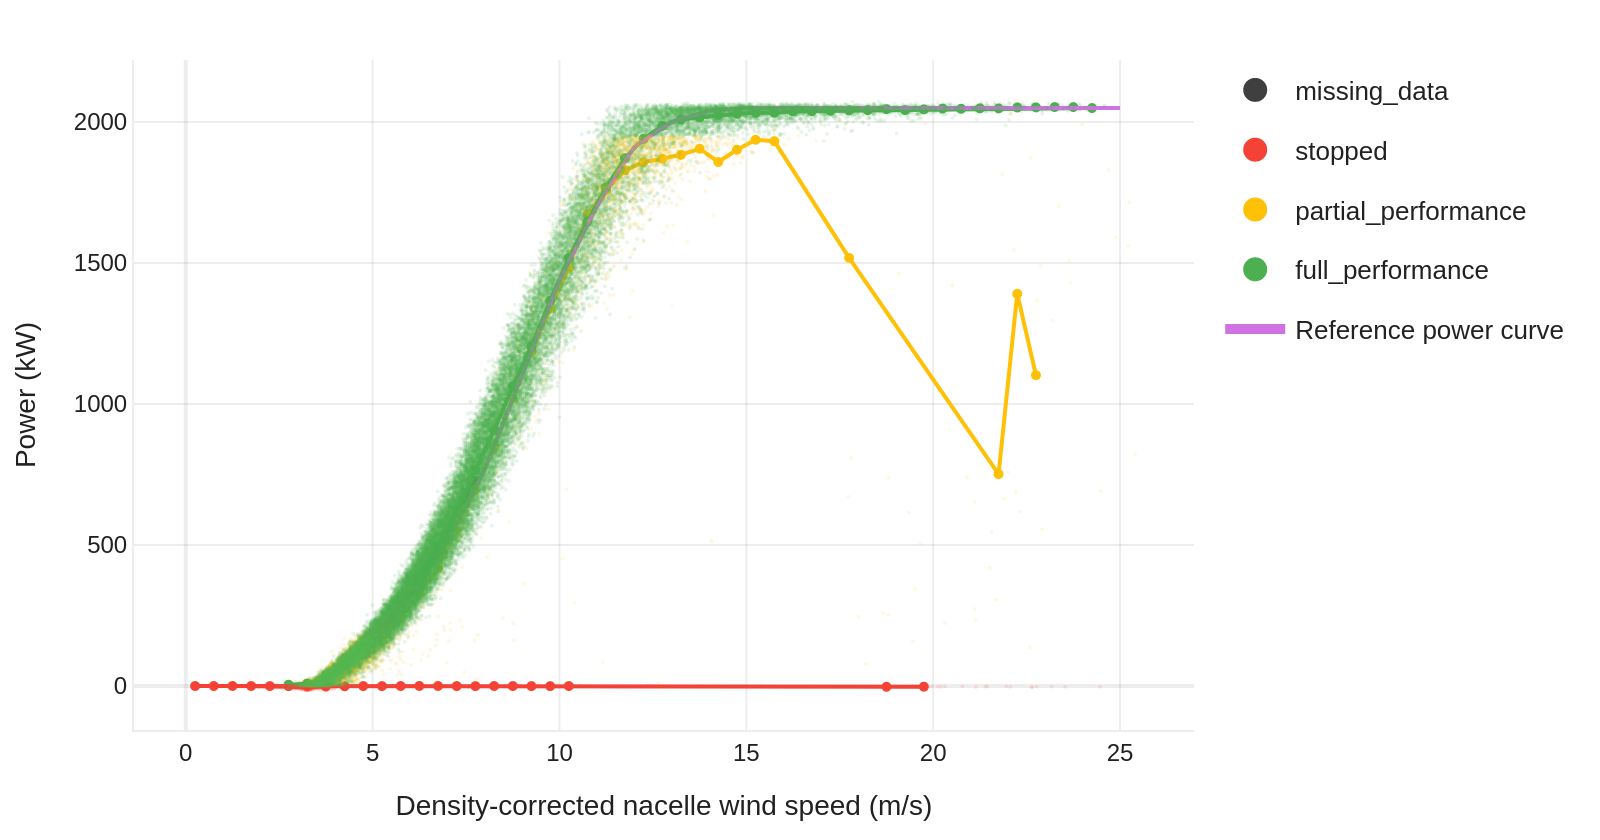
Power curve by operating status
Each 10-minute record carries the SCADA operating status of the turbine. Only full-performance records are used to train the expected power model. Expected power is estimated for all other records: stops, partial performance, out of environmental specification and missing data.
Method
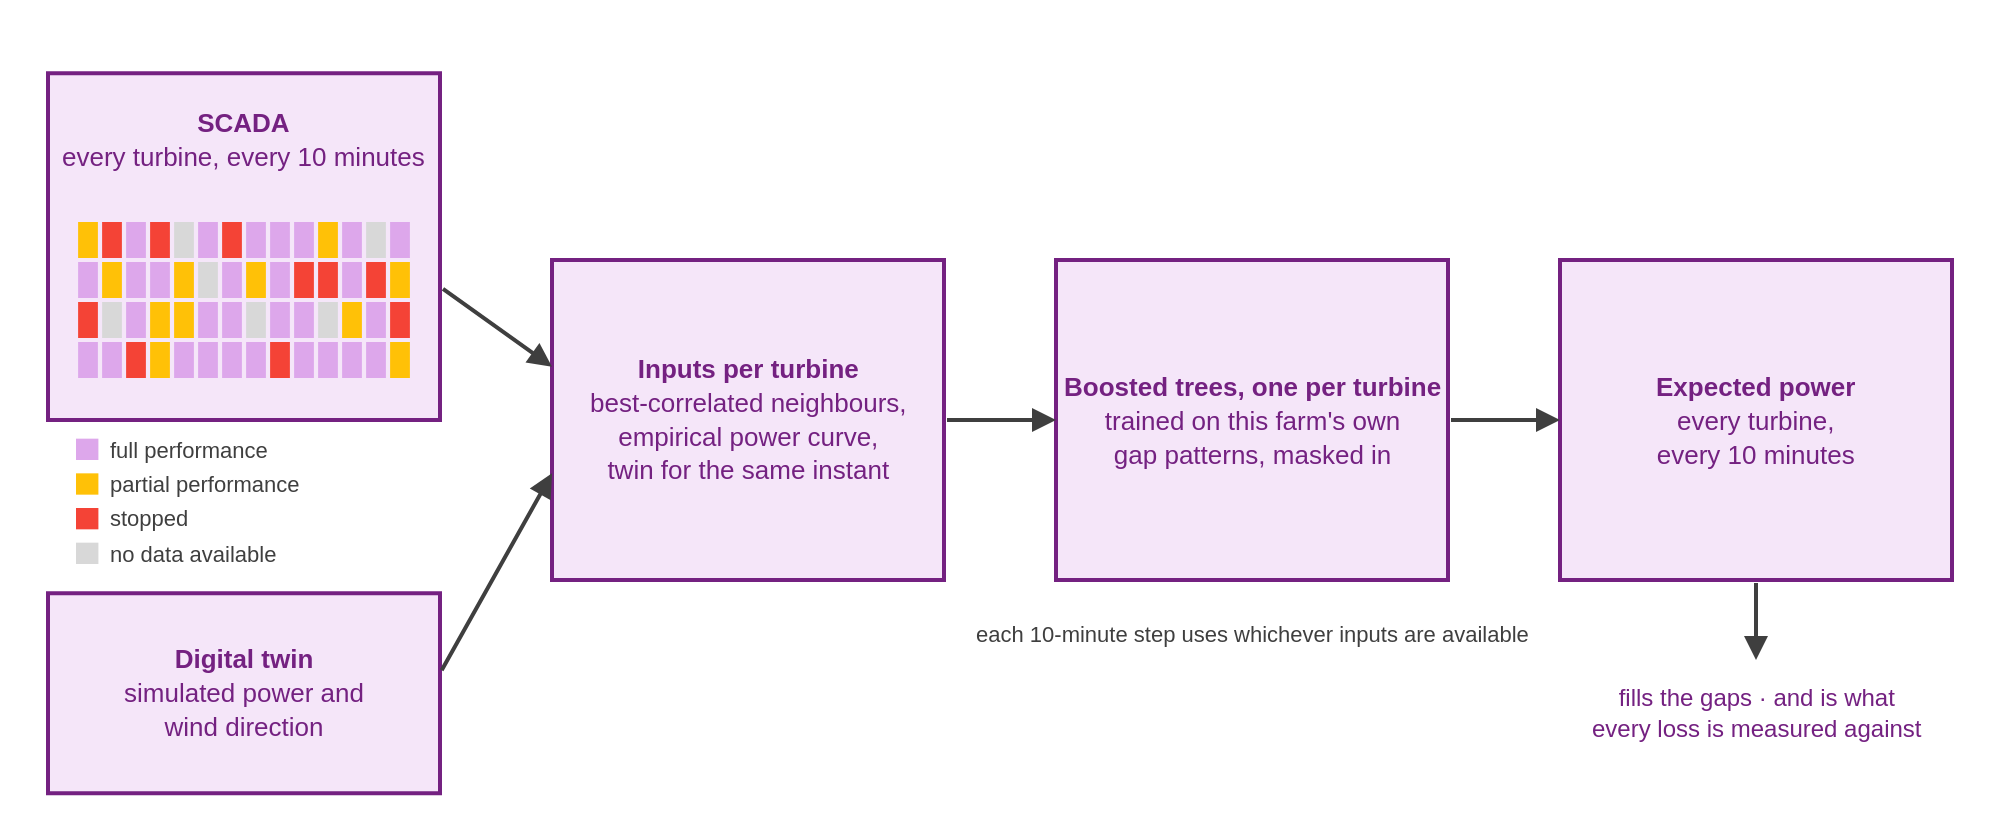
Expected power is estimated by one gradient-boosted tree model (XGBoost) per turbine, trained on the full-performance records of that turbine. The model inputs are:
- the power and nacelle direction of the neighbouring turbines whose production correlates most closely with it;
- the power and wind direction simulated by the digital twin for the same timestamp;
- the empirical power curve of the turbine, fitted on its recent history and corrected for air density.
During training, inputs are masked in the patterns of missing data observed in operation: a single signal, a whole turbine or the whole farm. The estimate therefore degrades gradually as data becomes unavailable. A turbine with insufficient history is modelled on the pooled records of the most similar turbines, with every input expressed relative to each turbine's neighbours.
Accuracy is evaluated on a chronologically held-out period, per turbine and per pattern of missing data, with the digital twin as the baseline. The same scores are computed for each period, so that a change in turbine behaviour, such as a retrofit, a controller change or a sensor drift, appears as a trend.
Lost production
Lost production is calculated with the production-based method of IEC 61400-26-1 (IEC, 2019). For each 10-minute record, the loss is the difference between expected power and actual power, with a lower bound of zero. Each loss is attributed to the operating status of the turbine: stopped, partial performance, out of environmental specification or missing data. No loss is attributed to full-performance records: the underperformance of a running turbine is measured against the digital twin, in the energy waterfall.