Operational power curve estimation
The operational power curve is the power curve of a turbine as observed on its site. It can differ from the reference power curve. Tipspeed estimates it by calibrating the wind speed input of the digital twin until simulated power matches SCADA power.
Typical use: a turbine-specific baseline to monitor performance drift over time.
Method
The calibration is quantile-based and uses full-performance records only. For each turbine:
- the distributions of simulated power and observed power are compared at the quantiles 0%, 2%, 4%, …, 100%;
- a spline model determines the wind speed adjustment required at each quantile to align simulated power with observed power;
- power is recalculated with the adjusted wind speeds to validate the correction.
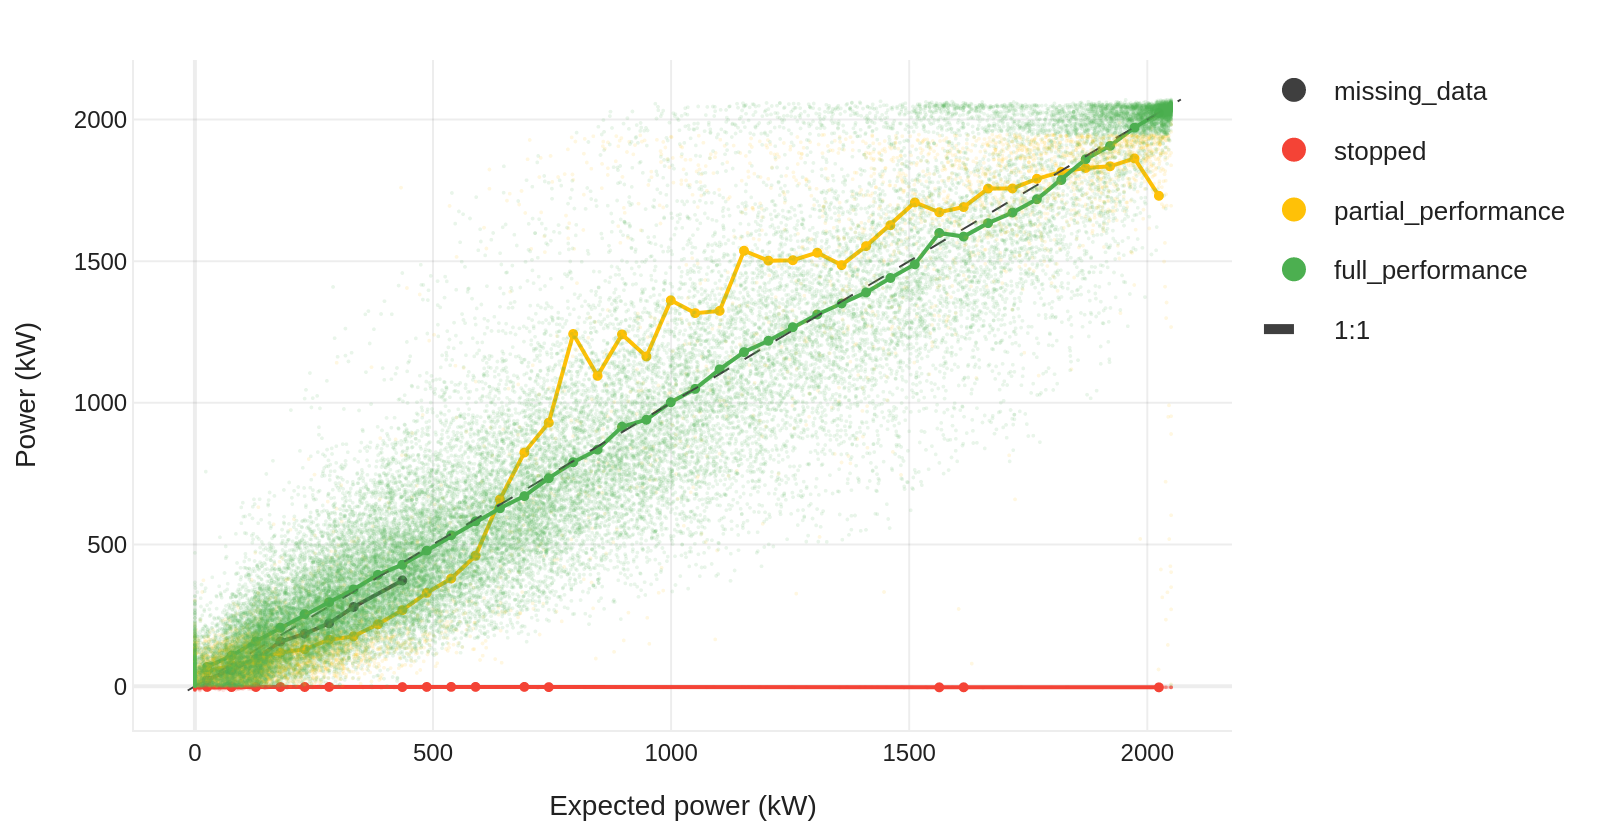
The correction represents the turbine-specific performance characteristics that the reference power curve does not include. On the turbine shown below, the quantile RMSE fell from 93.18 kW to 23.91 kW after calibration.
Applications
The calibration improves the accuracy of the power predictions of the digital twin, because it accounts for site- and turbine-specific performance. It also provides a baseline for performance drift monitoring.