Turbine performance
The turbine performance model converts the wind conditions at the rotor into expected power. It applies corrections for air density, turbulence intensity and wind profile to the reference power curve.
Air density normalisation
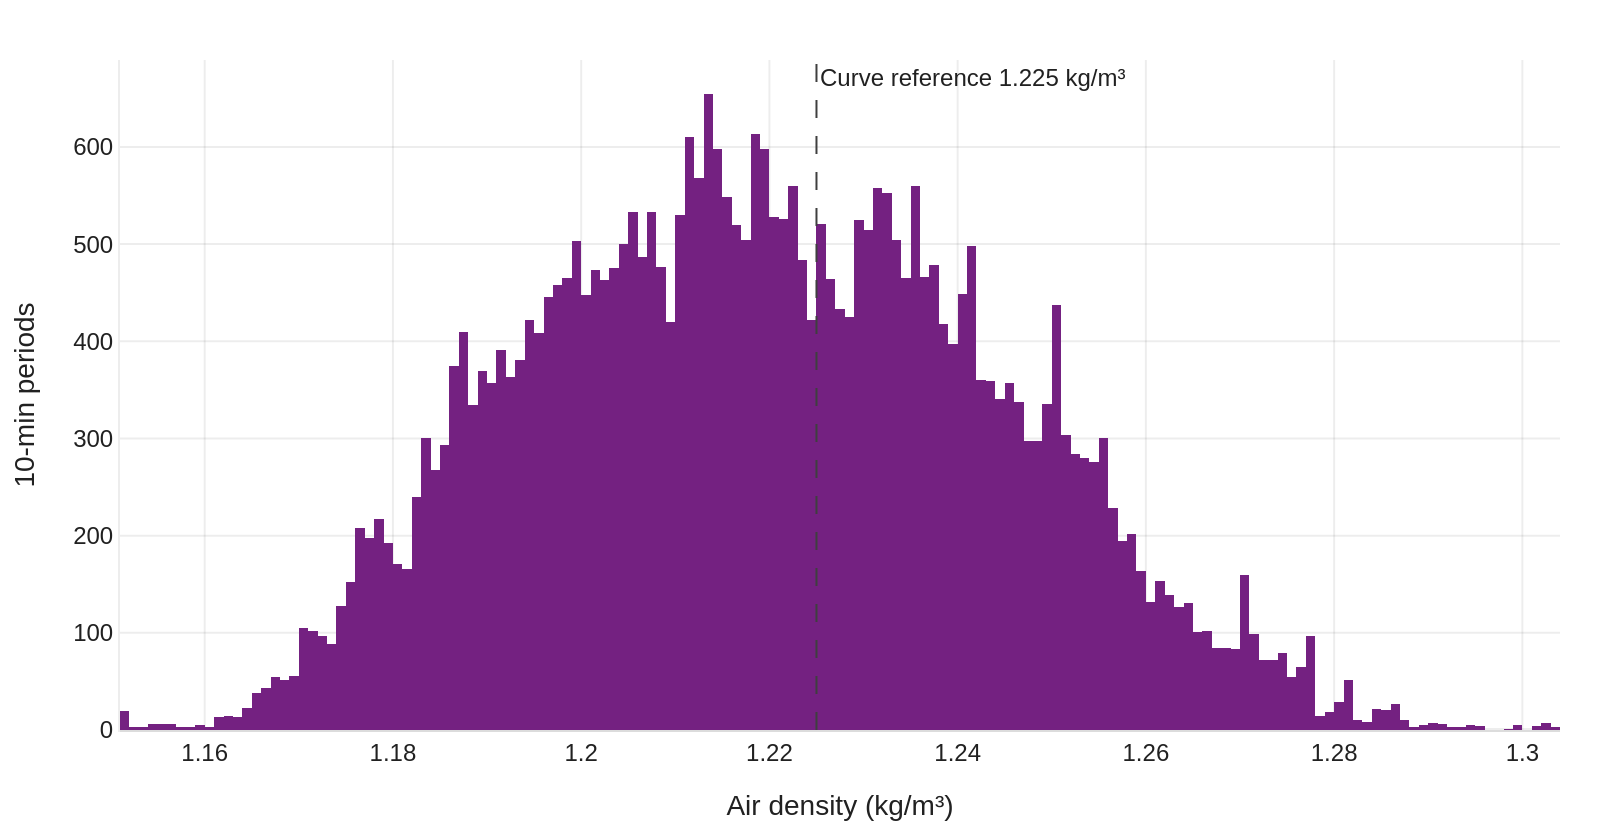
The model is based on the reference power curves of the turbines. Wind speed is normalised for air density on a 10-minute basis, following the standard method of IEC 61400-12-1 (IEC, 2017).
Turbulence intensity and wind profile
Two further models determine the power deviation caused by turbulence intensity and by non-standard wind profiles. Both are adapted from IEC 61400-12-1. They include empirical corrections for the power response of turbines to wind observed in operation (Davoust, 2018) (Davoust, 2024c), and are validated at scale against field data (Davoust, 2026).
Rationale for tuning the IEC corrections
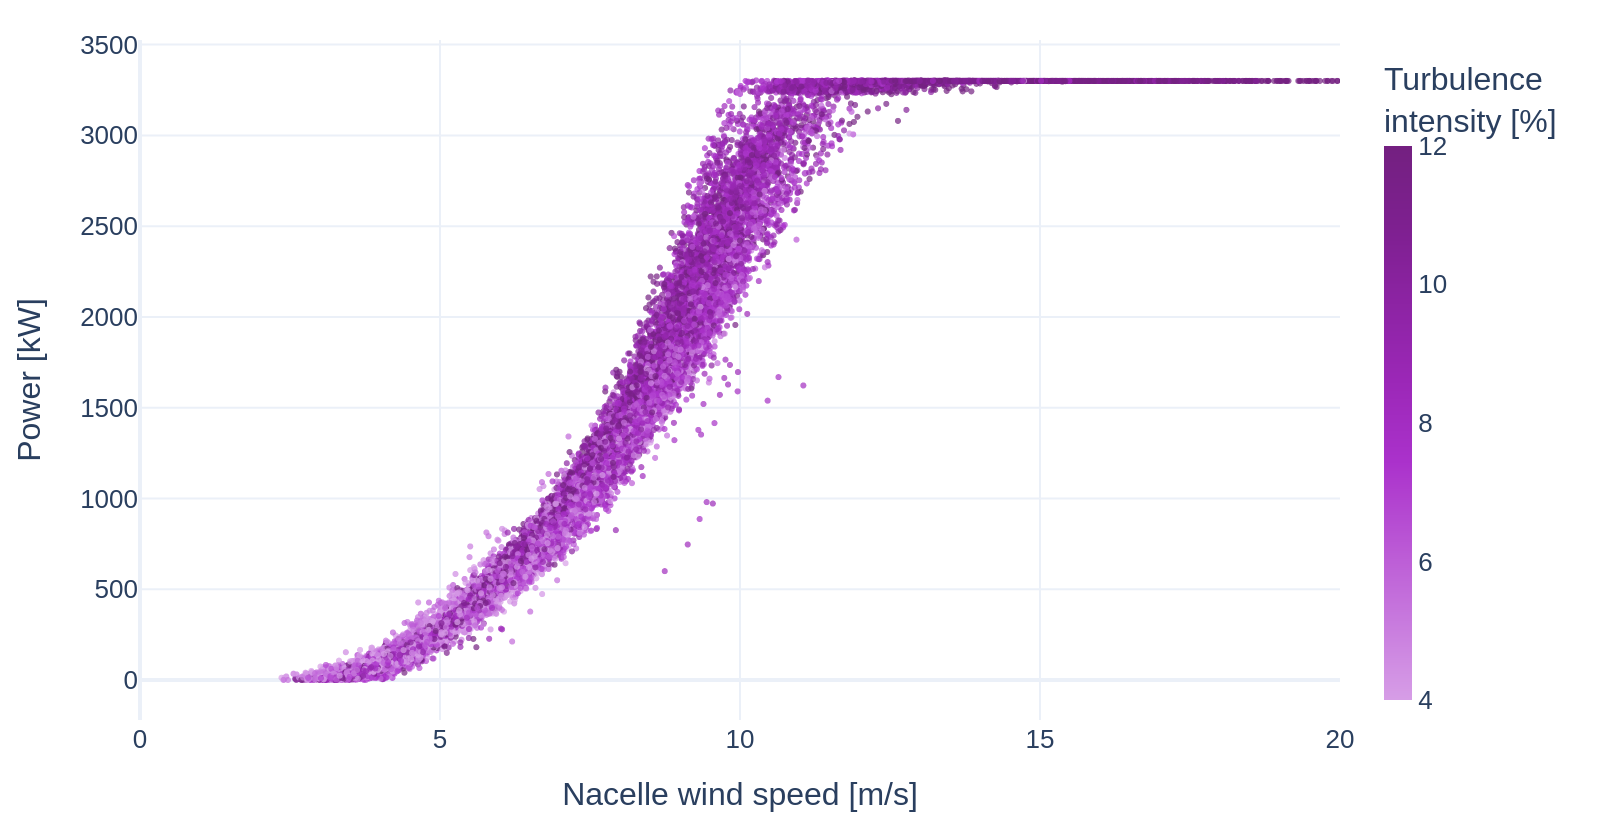
Turbulence intensity, wind shear, upflow and veer across the rotor plane can reduce production by several percent. These site-specific performance losses are nevertheless rarely validated. The Power Curve Working Group established that the IEC 61400-12-1 adjustments for rotor equivalent wind speed (REWS) and hub-height turbulence intensity do not consistently reduce the variation of measured performance across atmospheric conditions (Davoust, 2018).
The common industry practice is a power deviation matrix derived from power curve tests. These matrices are based on limited, proprietary datasets and may not generalise beyond the conditions tested. This applies in particular to larger turbines, which are more sensitive to these effects and less represented in the existing data.
Tipspeed instead adjusts the physics of the two IEC methods, as described below, and validates the result on operational data across its project portfolio (Davoust, 2026).
Tuned rotor effective wind speed
IEC 61400-12-1 defines a rotor effective wind speed (REWS) correction for non-standard wind profiles. The correction extends first principles to non-homogeneous flow. It assumes that the turbine extracts energy according to the average of the cubed wind speed across the rotor disk.
The conversion of a wind profile into power, however, differs from one turbine to another. It depends, among other factors, on the contribution of each blade section to production. Tipspeed therefore tunes the REWS correction by minimising the error between the observed power and the power predicted from the REWS-corrected wind speed.
The method computes a profile correction factor \( f \):
where:
- \( H_1 \), \( H_2 \) are the lower and upper bounds of the rotor disk
- \( l(z) \) is the rotor area weighting function at height \( z \)
- \( \alpha(z) \) is the upflow angle at height \( z \)
- \( \phi(z) \) is the wind direction veer deviation angle at height \( z \)
- \( v(z) \) is the wind speed at height \( z \), and \( v(z_0) \) the reference wind speed at the reference height \( z_0 \)
- \( n \) is an empirical exponent, tuned per turbine type
The factor is evaluated on the measured profile (\( f_{meas} \)) and on a reference profile (\( f_{ref} \), a power law with a fixed exponent). The corrected wind speed \( v_{corr} \) is:
Tuned turbulence intensity correction
IEC 61400-12-1 also defines a correction of the power curve for non-standard turbulence intensity (TI). The standard method models the effect of turbulence by averaging a steady-state power curve at 0% TI over the distribution of instantaneous wind speeds. This method assumes that the turbine responds to every turbulence scale measured at hub height. The corrected power is:
where \( P_{est}(TI_{meas}) \) and \( P_{est}(TI_{ref}) \) are the expected power under measured and reference turbulence conditions.
This assumption does not fully represent turbine behaviour. Small turbulence scales are not spatially correlated across the rotor disk and are averaged out over the rotor area. The turbulence intensity that drives the power response is therefore lower than the point measurement at hub height.
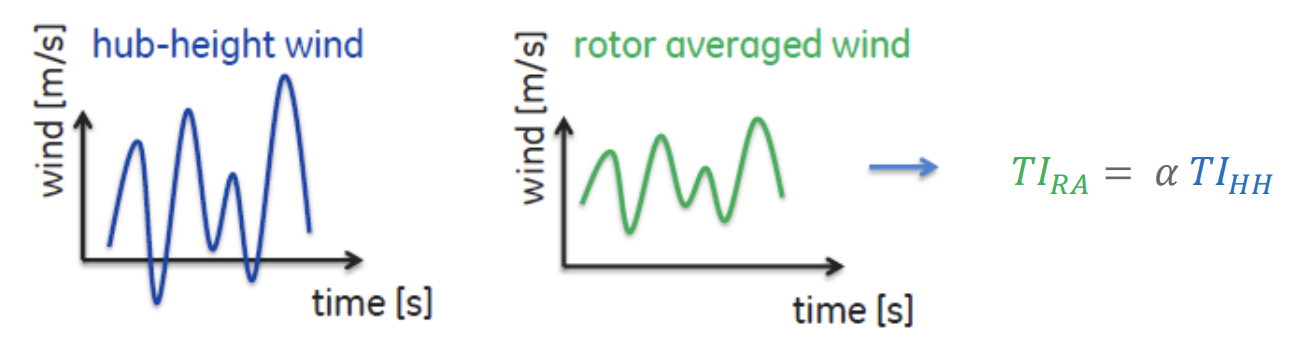
The tuned correction introduces a rotor-averaged turbulence intensity \( TI_{RA} \), derived from the hub-height measurement \( TI_{HH} \) through an empirical scaling factor \( \beta \) (typically \( \beta < 1 \)):
The power correction is then applied with the rotor-averaged turbulence intensity:
\( \beta \) is calibrated per turbine type by minimising the residual power performance variation across atmospheric stability conditions. The calibration accounts for the rotor geometry, size and control system response of each turbine model.
Validation of the tuned corrections
The tuned REWS and TI corrections are validated by applying them in a wind farm digital twin and comparing the results with SCADA data. Within each wind-speed bin, the validation checks that the modelled power follows the change of the measured power with turbulence intensity.
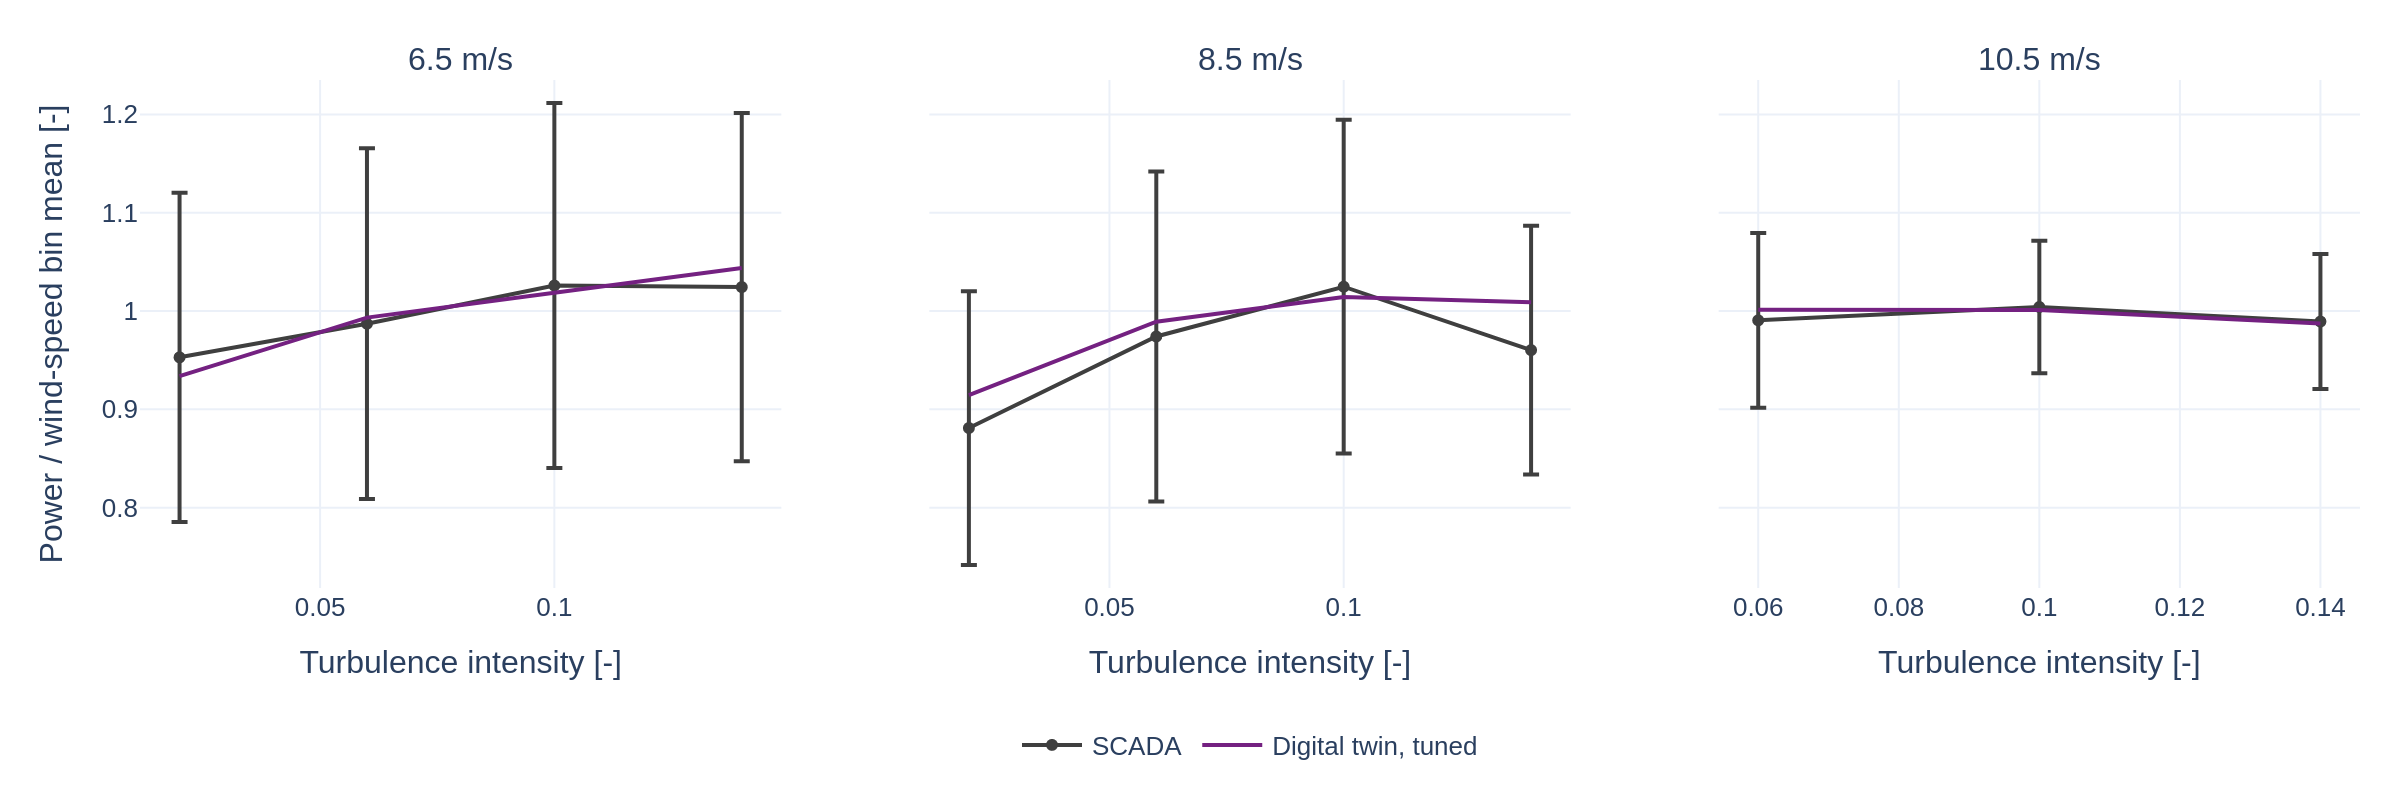
The corrections have also been validated at scale (Davoust, 2026), on:
- 11 sites, two of them offshore;
- 334 turbines;
- 1.55 million freestream, normal-operation SCADA timestamps.
The validation targets power residuals: the deviation of each 10-minute point from the mean power curve trend. The datasets are normalised by rated power and rated wind speed, so that turbines of different sizes can be compared. Observed residuals span −10% to +10% of rated power. Their trends with wind speed and turbulence intensity are consistent with power performance tests. The model reproduces the residuals with a correlation of 0.78 and a bias below 0.15% of rated power.