Wind farm performance ratio
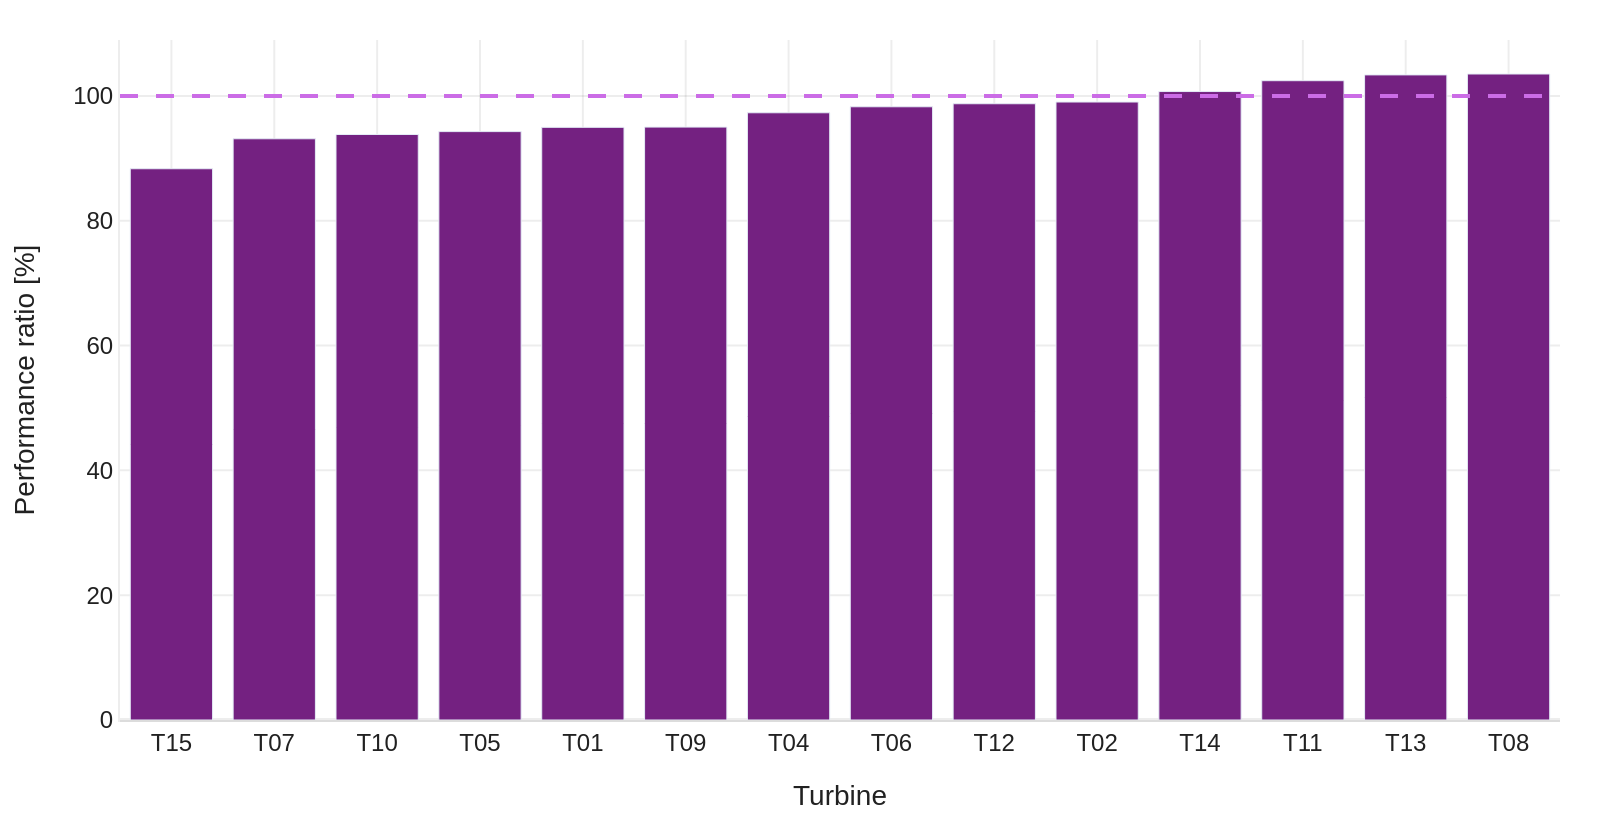
The performance ratio of a wind farm is its production at 100% availability divided by the production expected after wake losses over the same period, in percent. A value of 100% means the running turbines produced the energy expected for the wind they received.
Formula
Performance ratio performance_ratio
Actual production at 100% availability divided by the expected production after wakes; 100% means the running turbines produced the expected energy.
graph LR
  actual_100pct_avail_energy(["Actual (100% availability)"])
  expected_energy["Expected"]
  freestream_current_energy(["Freestream (current period)"])
  performance_ratio["Performance ratio"]
  wake_current_loss{{"Wakes loss (current period)"}}
  actual_100pct_avail_energy --> performance_ratio
  expected_energy --> performance_ratio
  freestream_current_energy --> expected_energy
  wake_current_loss --> expected_energy
  style actual_100pct_avail_energy fill:#F5E6F9,stroke:#742181,color:#2C1E4A
  style expected_energy fill:#F5E6F9,stroke:#742181,color:#2C1E4A
  style freestream_current_energy fill:#F5E6F9,stroke:#742181,color:#2C1E4A
  style performance_ratio fill:#F5E6F9,stroke:#CB6CE6,stroke-width:3px,color:#2C1E4A
  style wake_current_loss fill:#F5E6F9,stroke:#742181,color:#2C1E4A
Unit: %
Assumptions: Ratio of summed energies over the period.
Comes from: Actual (100% availability), Expected
Effects on the ratio
The table lists the effects that change the performance ratio and the step in which each effect is reported.
| Effect | Changes the ratio | Reason | Reported as |
|---|---|---|---|
| A period less windy than the long term | No | The expectation uses the wind of the same period | Windiness loss |
| Wake losses | No | The expectation is taken after wakes | Wakes loss |
| Turbulence, shear, upflow and veer at the site | No | The expectation includes the correction for site-specific performance | Site-specific performance loss |
| Stops, derating, out-of-specification conditions, missing data | No | Production is converted to a 100%-availability basis | Production losses |
| Under-performance of a running turbine | Yes | Yaw misalignment, a degraded power curve or controller settings reduce the output below the expectation | Under-performance loss |
Interpretation
A ratio below 100% results from the under-performance loss, defined as Expected minus Actual (100% availability). Hence, performance ratio = 100 × (1 − under-performance loss ÷ Expected).
The under-performance loss covers any shortfall of a running turbine relative to the reference power curve corrected for site conditions: yaw misalignment, a degraded power curve, a power curve never reached since commissioning, controller settings, or an error in the site-specific corrections. The yaw misalignment loss is also reported on its own, with the yaw misalignment estimation.
Example with illustrative values: an expected production after wakes of 10 000 MWh and a production at 100% availability of 9 600 MWh give a performance ratio of 96.0%, an under-performance loss of 400 MWh.
Comparison with the solar performance ratio
In photovoltaics, IEC 61724 defines the performance ratio as the final yield divided by the reference yield: the measured energy per kilowatt of rated power, divided by the in-plane irradiation normalised by 1000 W/m² (Sandia PVPMC). The same principle applies to wind: measured output divided by the output that the available resource permits.
The reference differs. A PV plant has a single measurable resource, the irradiance on the module plane. In a wind farm, each rotor receives a different wind, influenced by terrain, wakes and atmospheric conditions. The reference must therefore be modelled. Tipspeed uses the expected production of the digital twin after wakes.
Comparison with availability and capacity factor
Availability (IEC 61400-26-1) indicates whether turbines were able to operate, not how well they operated. Capacity factor combines wind resource, availability and performance in a single value. The performance ratio isolates how effectively the running turbines converted the wind they received into energy.
Frequently asked questions
Does a low-wind month lower the performance ratio?
No. The expected production is calculated with the wind of the same month, so the wind level does not affect the ratio. Windiness is reported as a separate step of the energy waterfall.
Does downtime lower the performance ratio?
No. Measured production is first converted to a 100%-availability basis. Stops, derating and missing data are reported in the production-loss steps of the waterfall.
Over which periods and scopes can the performance ratio be computed?
Over any period, for the whole farm or for each turbine. Through the API, the performance_ratio metric is requested
with a period such as 1mo.