Reading the wind farm energy waterfall
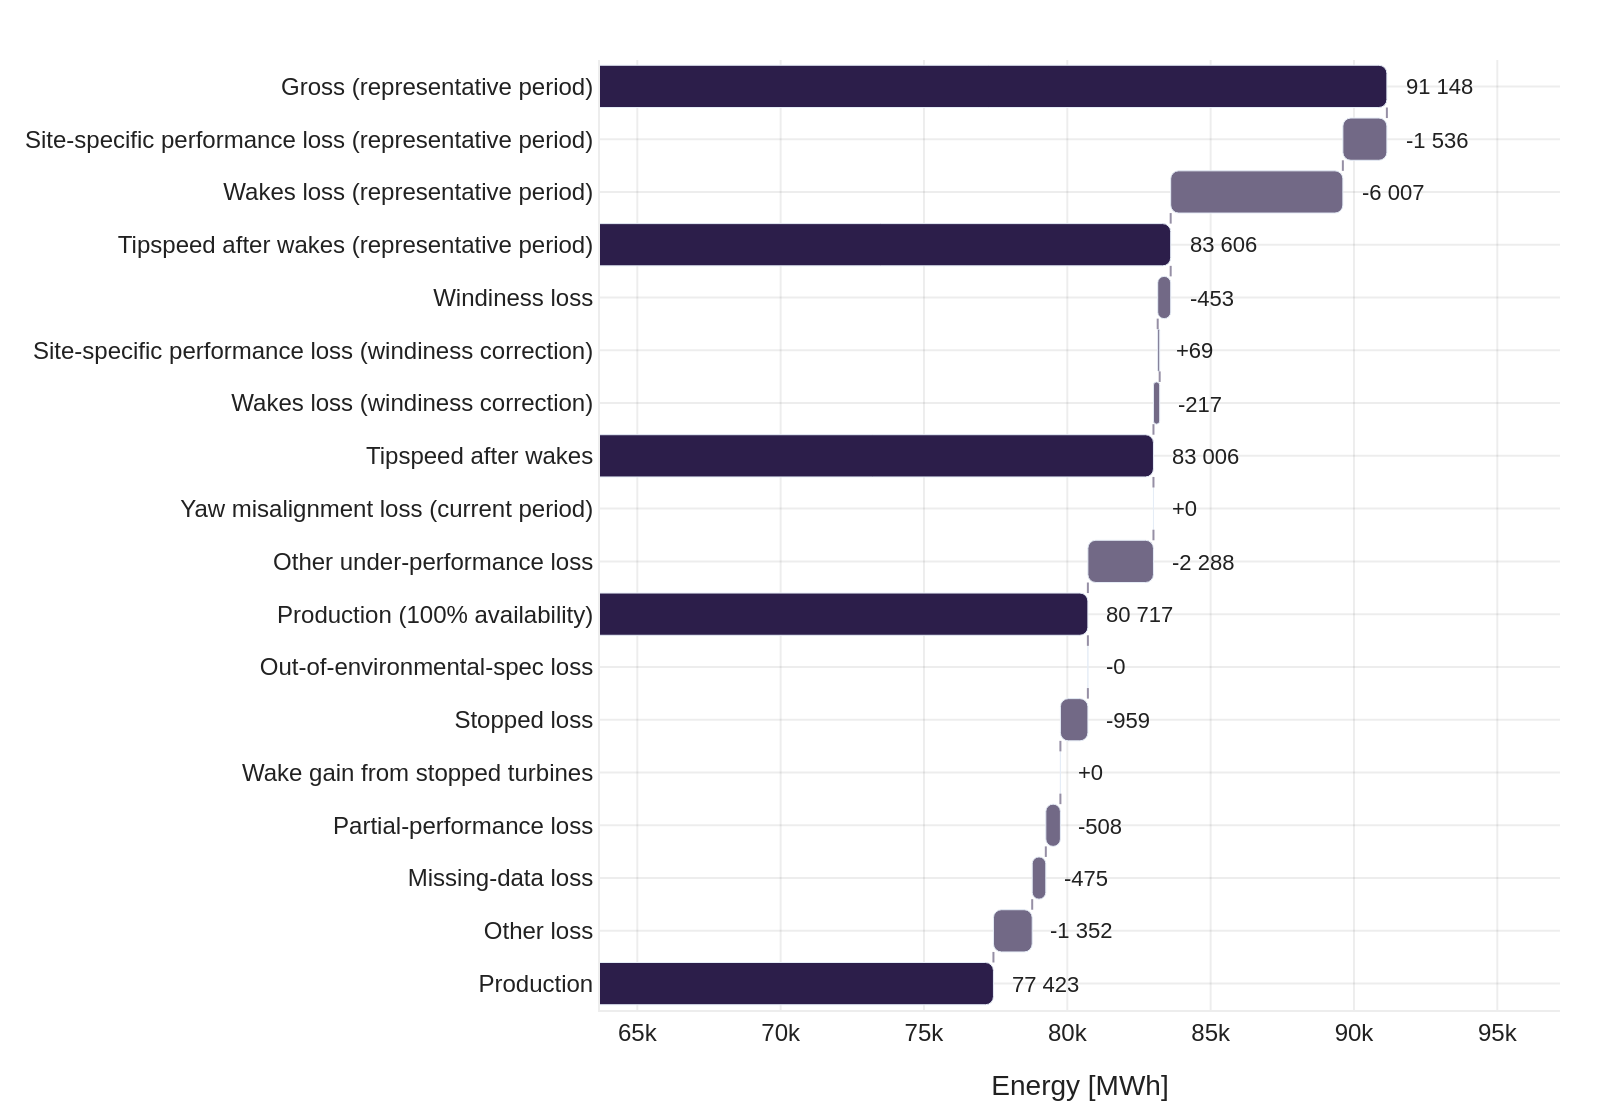
The energy waterfall breaks down the difference between the expected gross production of a wind farm in the long-term climate and its actual production into successive steps, one per cause. Windiness is isolated in a single step, so that the remaining steps represent performance or availability effects.
Stages of the waterfall
The waterfall consists of four stages. Losses are deducted; the wake gain from stopped turbines is added back. Three levels close a stage and are drawn as full-height bars: Expected (long term), Expected and Actual (100% availability).
| Stage | Starts at | Steps | Ends at |
|---|---|---|---|
| 1. Long term | Expected gross (long term) | Site-specific performance loss (long term), wakes loss (long term) | Expected (long term) |
| 2. From long term to the current period | Expected (long term) | Windiness loss, then the windiness corrections of site-specific performance and of wakes | Expected |
| 3. Performance assessment | Expected | Under-performance loss | Actual (100% availability) |
| 4. Production losses | Actual (100% availability) | Out-of-environmental-spec loss, stopped loss, wake gain from stopped turbines (added back), partial-performance loss, missing-data loss, other loss | Actual |
Starting from the energy budget
The waterfall can also start from the P50 of the energy yield assessment, pre- or post-construction, instead of Expected (long term). The gap between the budget and the actual production is then broken down step by step, so that the part due to the wind is separated from the part that can be recovered. The difference between the P50 and Expected (long term) is reported as a separate step.
Formulas
The definition and formula of each level and step are given in the Metrics glossary, by stage: long term, current period, performance assessment and production losses.
Windiness step
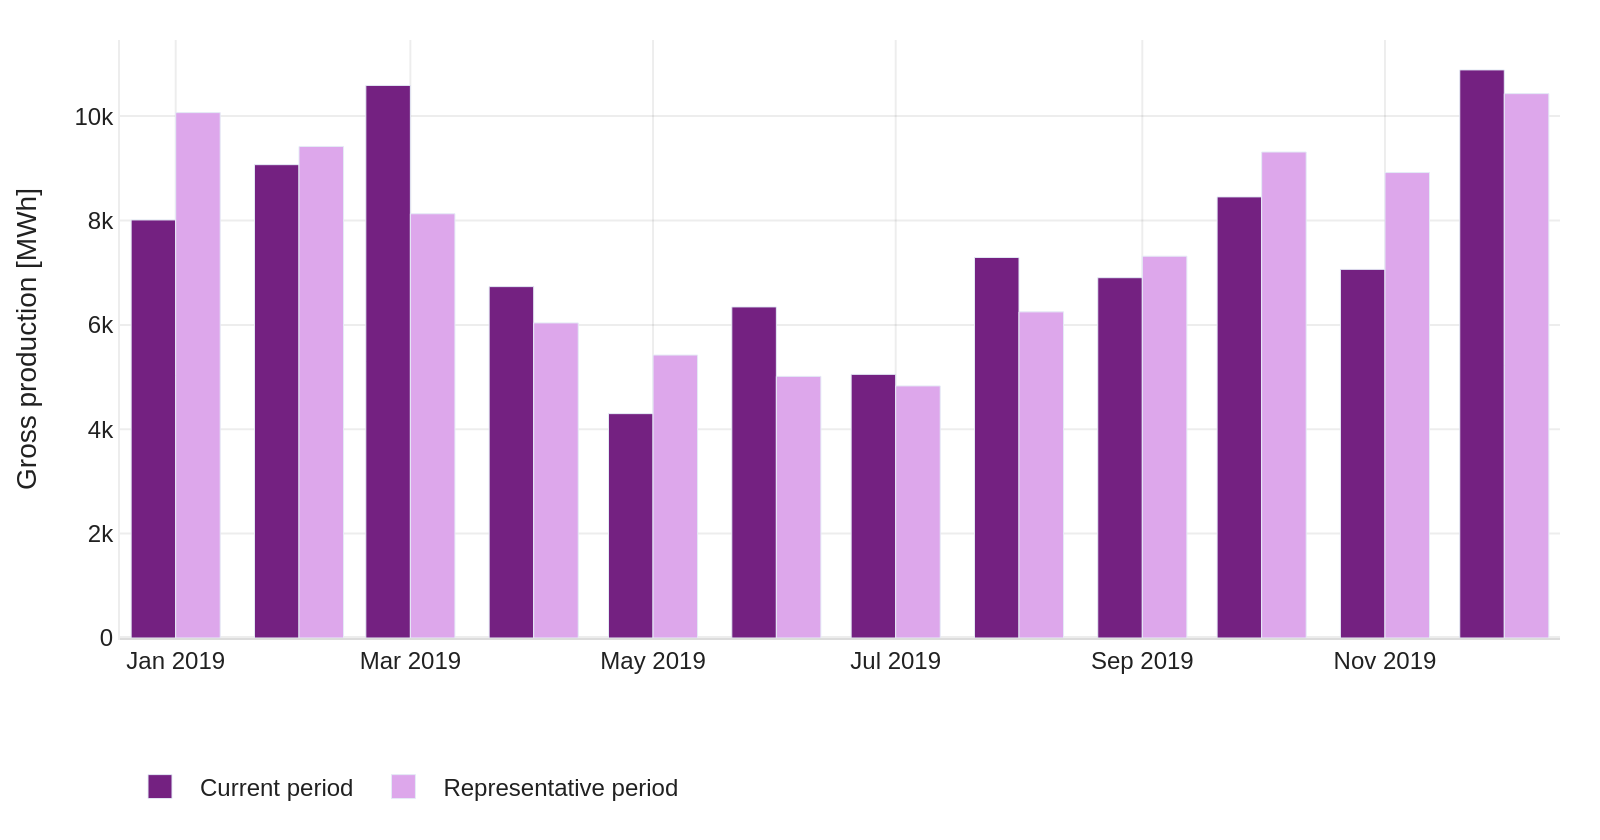
Year-to-year variability of the wind is the largest driver of annual production. A comparison between periods, or between farms, therefore requires a common climate reference. The waterfall starts from the long-term climate of the site, built as a representative period (see Long term), and reaches the current period through a single windiness step. Site-specific performance and wake losses also depend on the wind conditions of the period, so each carries its own windiness correction.
Wake gain from stopped turbines
A stopped turbine produces no wake. The turbines downstream of it therefore produce more than they would if it were running. Production at 100% availability assumes that every turbine is running, so it excludes this gain. The gain is added back as a separate step, next to the stopped loss, so that the energy chain ends at measured production.
Frequently asked questions
Where is the performance ratio located in the waterfall?
The performance ratio relates the two ends of stage 3: Actual (100% availability) divided by Expected.
Where is the yaw misalignment loss in the waterfall?
It is not a separate step. The under-performance loss of stage 3 includes it. The yaw misalignment loss is reported with the yaw misalignment estimation and counted in the recoverable energy.
What is recoverable energy?
Recoverable energy is the total energy that can be recovered by correcting yaw misalignment and by reducing bat, noise and wind-sector-management curtailment to their expected levels. Only categories above their expected level are included.
Is the waterfall available through the API?
Yes. GET /api/beta/projects/{team}/{project}/energy-chain-summary returns the gross-to-net energy waterfall for a
date range.